** Progress in Earth and Planetary Science is the official journal of the Japan Geoscience Union, published in collaboration with its society members.
Gallery View of PEPS Articles
Review
Solid earth sciences
202309202309
Seismic noise between 0.003 Hz and 1.0 Hz and its classification
Toshiro Tanimoto, Aaron AndersonToshiro Tanimoto, Aaron Anderson
Low-frequency seismic noise, Ocean–solid earth interaction, Wave–wave interaction, Quasi-static deformation
Figure:
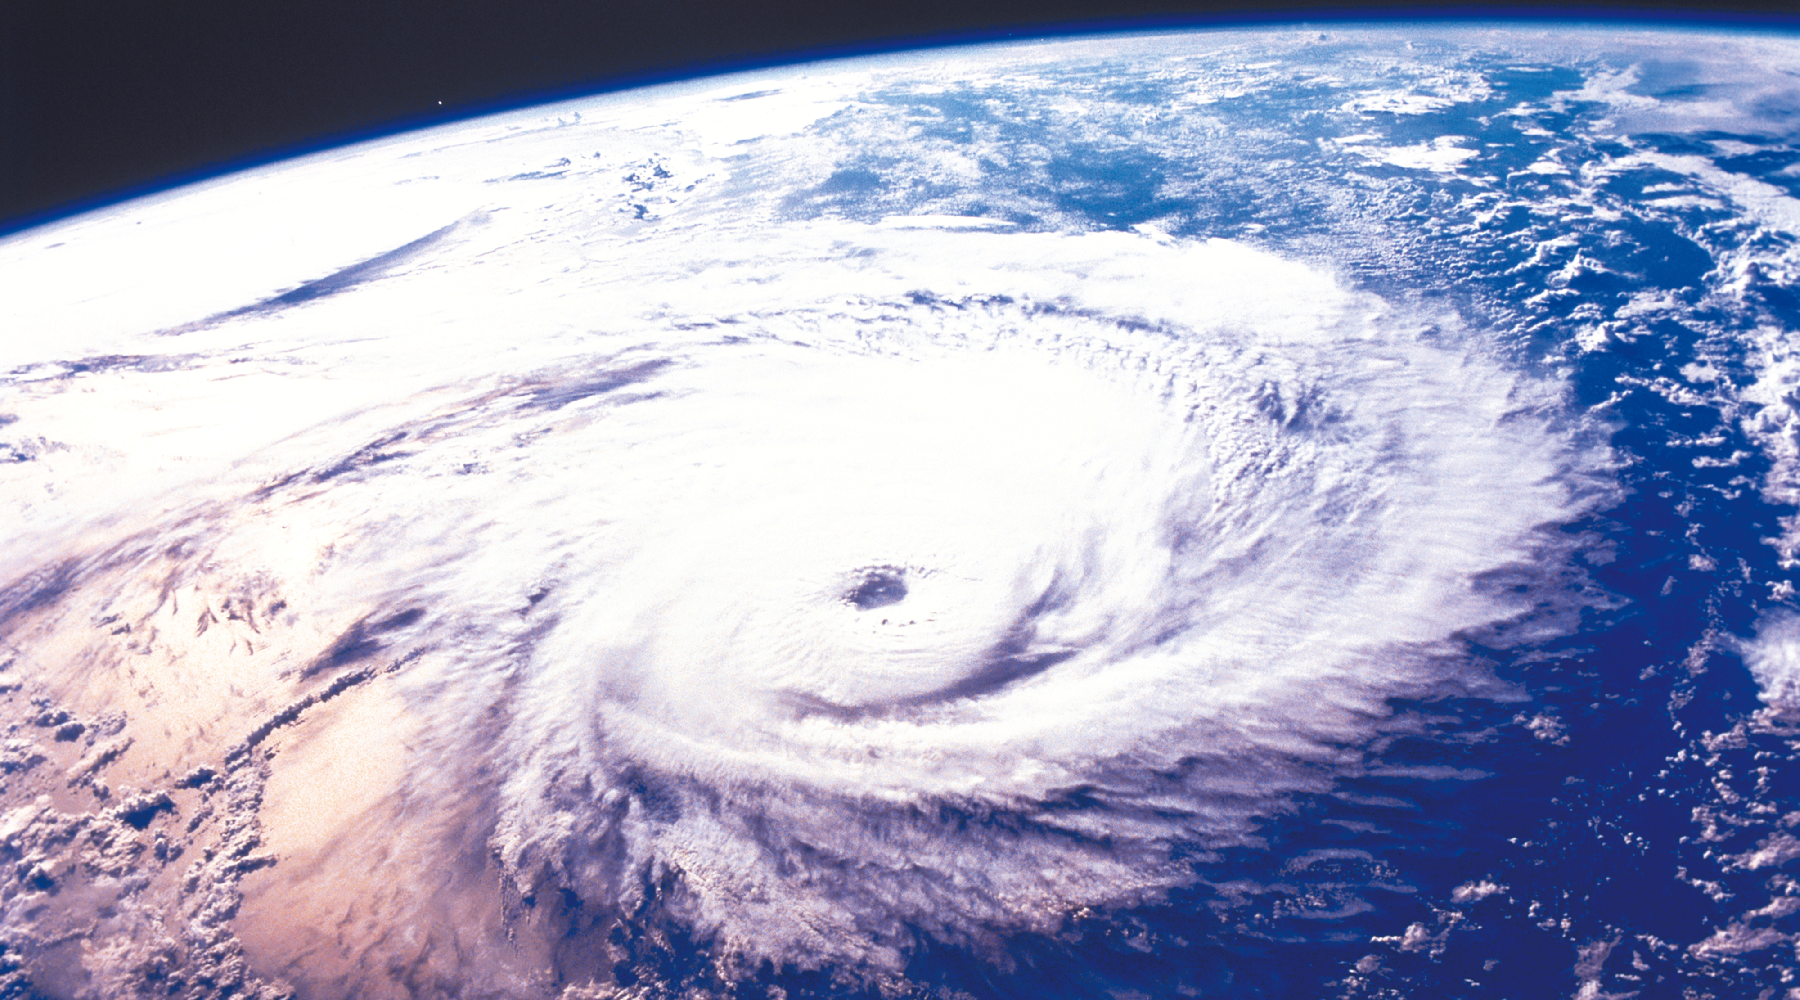
(a) Beamforming for P-wave sources by an array analysis of the Southern California Seismic Network. There was a P-wave source near Hurricane Sandy when it (its center indicated by a white square) moved northward off the East coast of USA. In the same time interval, a low-pressure system in the northern Pacific Ocean was also emitting P waves. Body waves are often excited near a low-pressure system through the wave-wave interaction of ocean waves.
(b) Pressure inside a tornado is much lower than the ambient atmospheric pressure. When a tornado touches the Earth’s surface, it acts as a single force because of this pressure difference and excites seismic waves. The excitation source strength, inverted from seismic data, matches the temporal variation of the Fujita scale determined for a tornado.
(c) In the frequency band 0.3-1.0 Hz, a slightly higher frequency band than the secondary microseism, we can see seismic noise caused by the wave-wave interaction of local ocean waves that in turn were generated by local winds. High amplitudes in seismic waves (top) and ocean waves (middle) are indicated by white and show close agreements in their temporal behavior. Wind speed (bottom) also shows a good correlation with ocean wave data, especially if we focused on high speed time intervals.
(d) Plot of vertical seismic PSD against pressure PSD allows us to separate the propagating seismic signals from distance sources and the loading ground deformation signals from local pressure sources. For pressure less than the one indicated by the vertical dashed line, the signals are propagating seismic waves from distant sources because their amplitudes are not affected by local pressure variations. For pressure higher than the dashed line, vertical seismic amplitudes increase with local pressure, indicating that they are generated by local surface pressure loading. Data from two EarthScope Transportable stations (KMSC, U57A) were used. Each point is from an analysis of 1-hour-long time series and the data were from the year 2014.
It is now established that the primary microseism, the secondary microseisms, and the hum are the three main components of seismic noise in the frequency band from about 0.003 Hz to 1.0 Hz. Monthly averages of seismic noise are dominated by these signals in seismic noise. There are, however, some temporary additional signals in the same frequency band, such as signals from tropical cyclones (hurricanes and typhoons) in the ocean and on land, stormquakes, weather bombs, tornadoes, and wind-related atmospheric pressure loading. We review these effects, lasting only from a few hours to a week but are significant signals. We also attempt to classify all seismic noise. We point out that there are two broad types of seismic noise, the propagating seismic waves and the quasi-static deformations. The latter type is observed only for surface pressure changes at close distances. It has been known since about 1970 but has not been emphasized in recent literature. Recent data based on co-located pressure and seismic instruments clearly show its existence. Because the number of phenomena in the first type is large, we propose to classify all seismic noise into three categories: (1) propagating seismic waves from ocean sources, (2) propagating seismic waves from on-land sources, and (3) quasi-static deformation at ocean bottom and on land. The microseisms and the hum are in the first category although there are differences in the detailed processes of their excitation mechanisms. We will also classify temporary signals by these categories.
